User interface
Check our iPath user interface video tutorial.
Main user interface
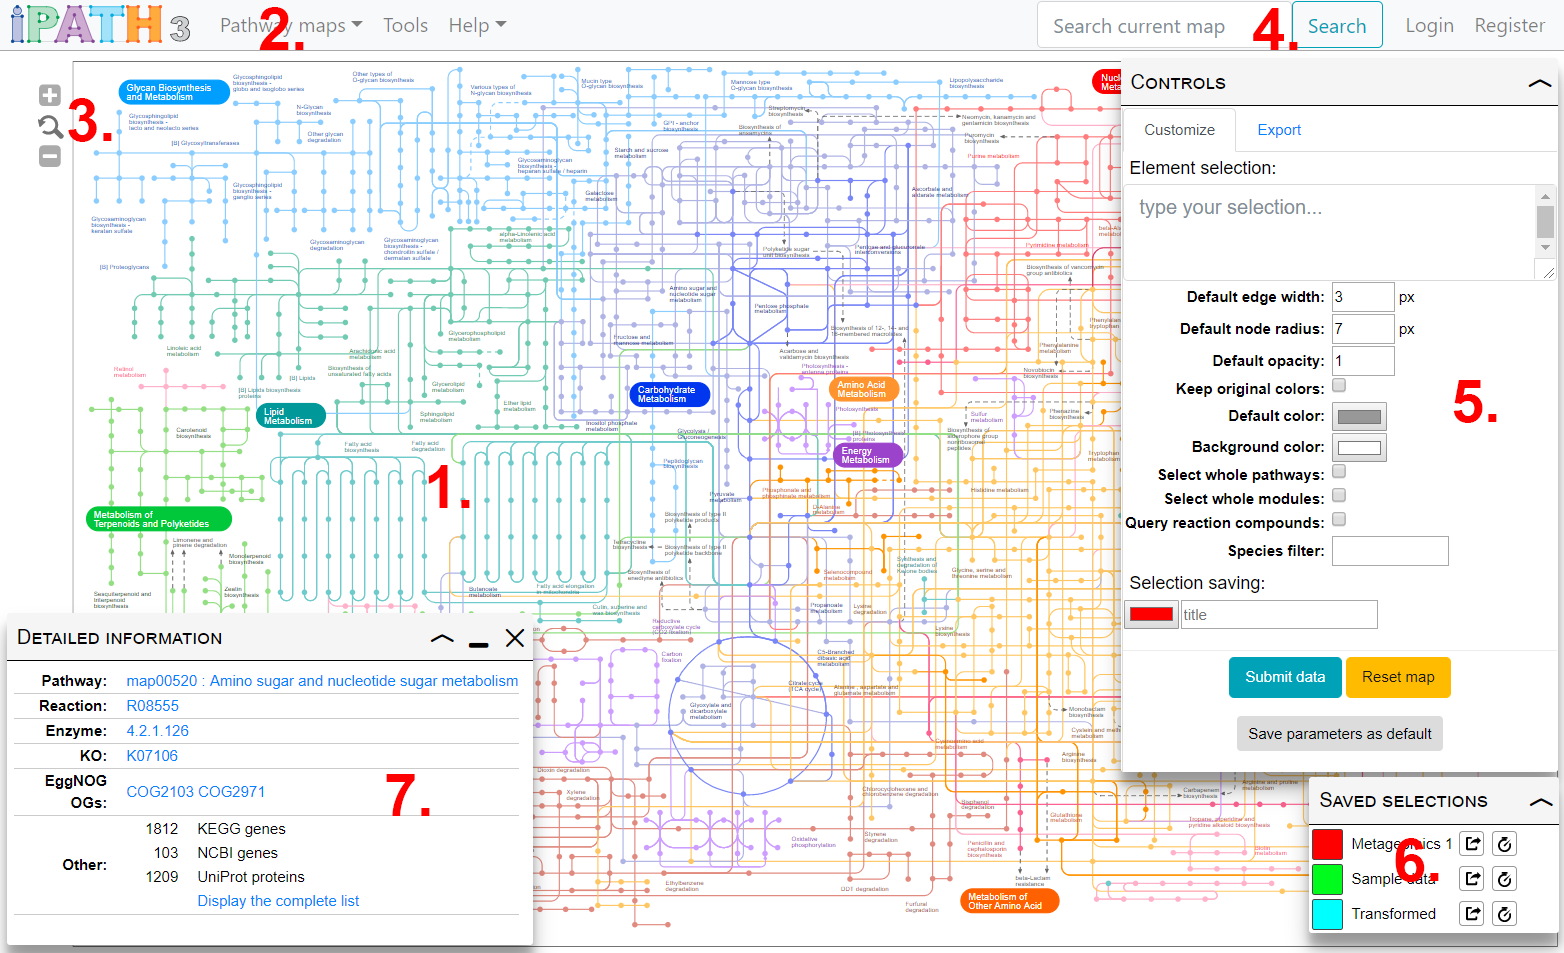
Main parts of iPath's user interface are shown in the image on the right.
- Main map display displays the currently selected map. Use the icons in the top right to zoom, or use your mouse wheel.
- Use the Map selection menu to switch between various pathways maps available in iPath.
- Zoom controls. You can also change the zoom level by using your mouse wheel.
- Map search. See the Search section for details
- Map customization. Element selection and other customization options are available in the control box. See the Map customization for details
- Saved selections. Any saved selections can be restored or permanently saved.
- Element information box. Click any map element to see detailed information on associated data.
Search
Map search
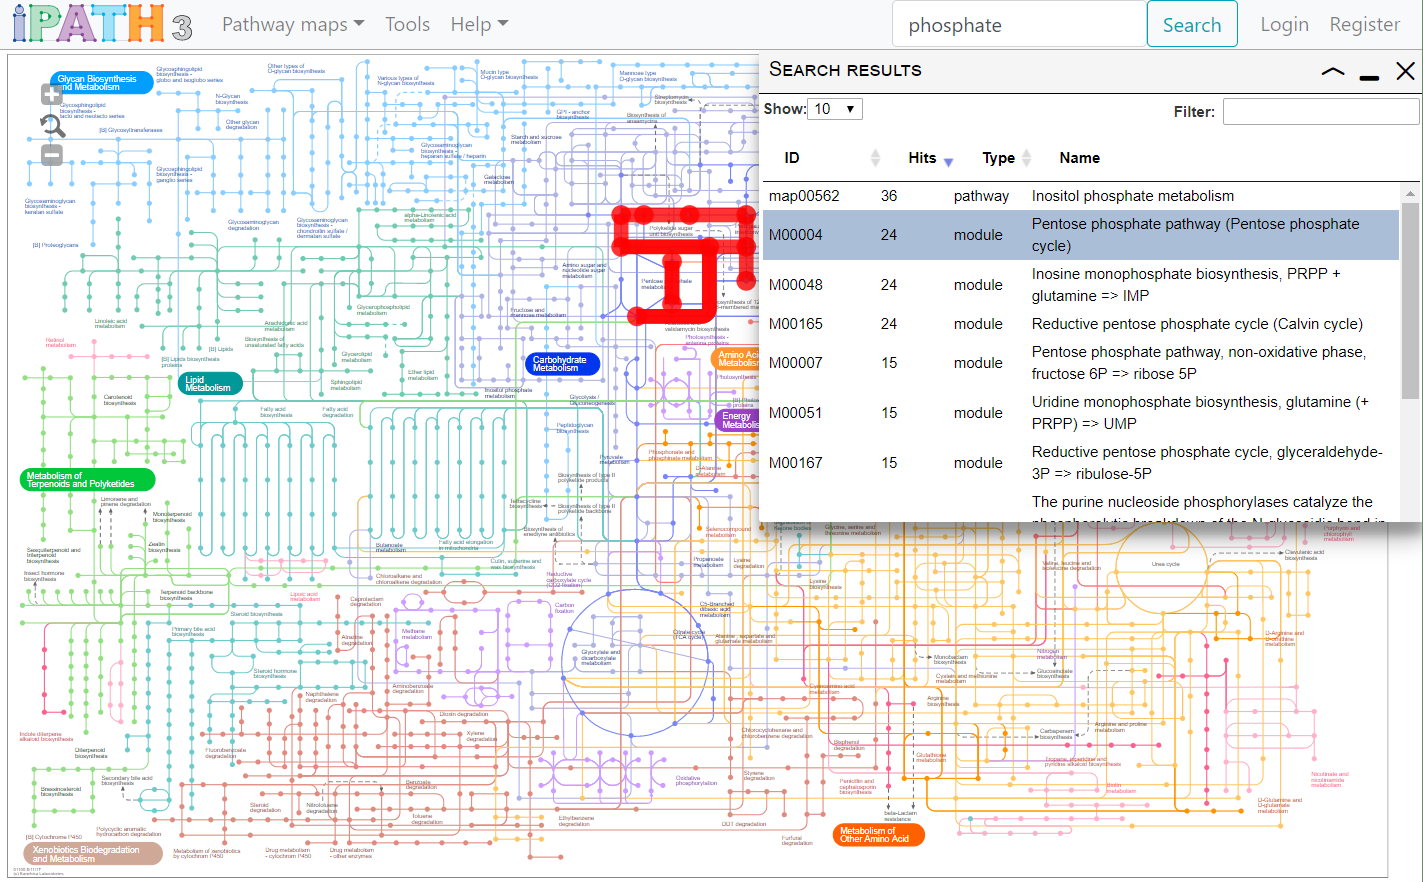
- Type your query into the box, and click the Search button. Data associated with all elements of the currently selected map will be searched.
- Table columns can be sorted by clicking on the headers, and the results further filtered by typing into the filter box.
- Clicking on a row in the results list will highlight all its occurrences in the map.
Identifiers and names of following data types will be searched:
- Compounds
- Pathways
- Orthologous groups
- Modules
- Enzymes
- Reactions
Map customization
Check our map customization video tutorial.
Customization panel
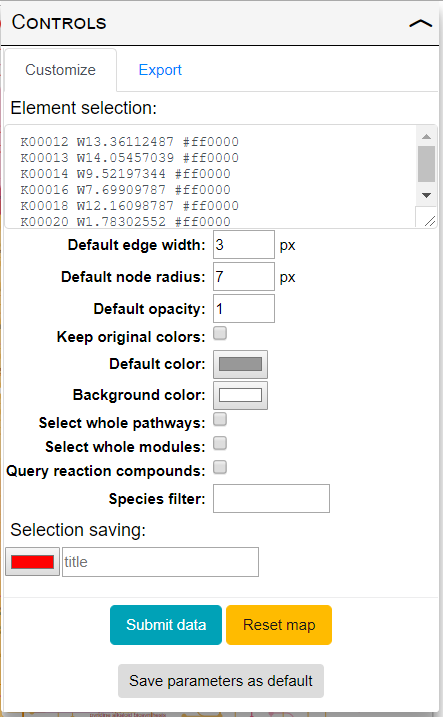
iPath provides powerful data mapping tools and extensive customization options. Customize tab in the in the controls panel (shown on the right) provides access to all available customization options. Hover your mouse cursor over individual options to see a short explanation. Various options are described in detail below:
- Element selection: Use this box to define customization parameters for various elements of the map.
Each node and edge in the maps has various types of data associated with it (see the list below for supported data types).
Each line of your element selection must start with an ID, followed by one or more customization parameters.
All elements in the map which are associated with the specified ID will be customized according to your parameters.
Three parameter types are supported:
- Color: can be specified in hexadecimal, RGB or CMYK notation (for example: #ff0000, RGB(255,0,0) or CMYK(0,100,100,0) )
- Width: prefix W followed by a number; used as line width for edges or radius for nodes
- Opacity: a number between 0 (fully transparent) and 1 (fully opaque)
An example element selection:
C00001 #0000ff W20 0.5
K01001 #ff0000
R01148 #ff0000 W10
In the example above, all map elements which contain water (KEGG compound ID C00001) will be colored blue (#0000ff), half transparent (opacity 0.5) and have width/radius 20px (W20). Elements which are associated with KEGG orthoulogous group K00824 will be colored green (#00ff00), fully opaque and use the default width. Elements which are associated with KEGG reaction R09112 will be colored red (#ff0000), fully opaque and have width/radius 10px (W10).
- Default edge width: A value between 1 and 30 (in pixels); will be used for all edges which do not match your selection, or do not have a width parameter specified in the selection.
- Default node radius: A value between 1 and 30 (in pixels); will be used for all nodes which do not match your selection, or do not have a width parameter specified in the selection.
- Default opacity: A value between 0 (fully transparent) and 1 (opaque), which is used for all elements of the map which DO NOT match any of your selection IDs.
- Keep original colors: when this box is checked, all elements in the map will keep their original color, except those changed by your selection
- Default color: this color will be used for non-selected parts of the map, when 'Keep original colors' box is not checked
- Background color: map background color
- Select whole pathways: when this box is checked, any selection matching a single edge or node within a pathway will highlight the whole pathway in the map
- Select whole modules: when this box is checked, any selection matching a single edge or node within a KEGG module will highlight the whole module in the map
- Query reaction compounds: when using KEGG compound IDs in your selection, checking this box will make iPath check for presence of those compounds within all reactions associated with map's edges. Matching edges will be highlighted using the parameters specified for the compound in your selection.
- Species filter: specify a NCBI taxonomy ID or KEGG 3 letter species code in this box to display only map elements which are present in that particular organism. Rest of the map will be displayed in gray.
- Selection title: If you provide a title when submitting an element selection, all parameters will be saved and available through the 'Saved selections' panel.
Supported data types
The following data types are supported by iPath, and can be used to customize the maps. Make sure you use the required prefix for each data type, as shown in the examples below.
| Data type | Prefix | Example ID |
|---|---|---|
| KEGG Pathways | - | map00650 |
| KEGG Modules | - | M00071 |
| KEGG Reactions | - | R01148 |
| KEGG Compounds | - | C00003 |
| KEGG KOs | - | K01000 |
| STRING proteins | - | 7165.AGAP001899-PA |
| KEGG proteins | - | aae:aq_626 |
| COGs/eggNOGG OGs | - | COG0007 |
| Enzyme EC numbers | E or EC | E2.4.1.82 |
| Uniprot IDs/ACCs | UNIPROT: | UNIPROT:Q93015 |
| NCBI GI IDs | NCBI-GI: | NCBI-GI:326314893 |
| CAS Registry Numbers | CAS: | CAS:7732-18-5 |
| PubChem CIDs | PubChem: | PubChem:3303 |
| ChEBI IDs | - | ChEBI:15377 |
| ChEMBL IDs | - | CHEMBL1098659 |
| PDB-CCD IDs | PDB-CCD: | PDB-CCD:HOH |
| 3DMET IDs | 3DMET: | 3DMET:B01124 |
| Nikkaji IDs | NIKKAJI: | NIKKAJI:J43.587B |
| KNApSAcK IDs | KNApSAcK: | KNApSAcK:C00001491 |
| LIPID MAPS IDs | LIPIDMAPS: | LIPIDMAPS:LMFA01060077 |
| Lipidbank IDs | LipidBank: | LipidBank:VCA0059 |
Current selection matching statistics
Selection match statistics
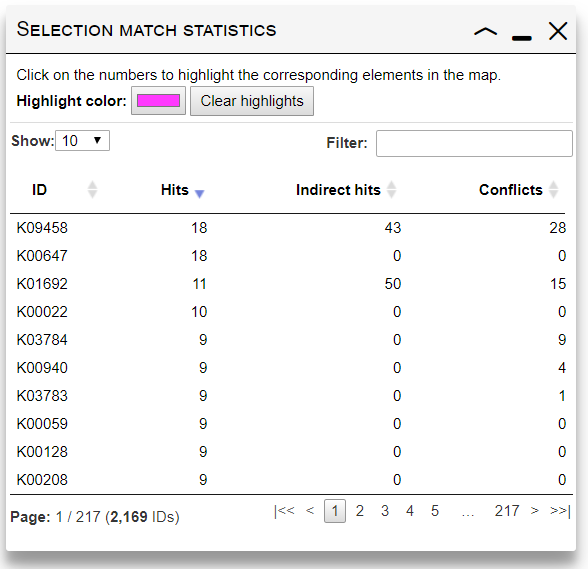
- Hits: shows the total number of edges/nodes which were matched by each submitted ID.
- Indirect hits: shows the number of edges/nodes matched through "Select whole pathways", "Select whole modules" or "Query reaction compounds" options.
- Conflicts: When multiple IDs with different parameters in your selection match the same element in the map, a conflict occurs. Only one set of parameters will be used (a random one). This column will show the number of conflicts where a particular ID occurs.
Click on any number in the table to highlight the corresponding edges/nodes.
Selection conflicts
Selection conflicts
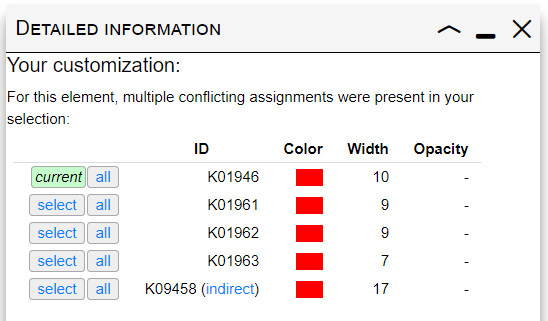
When multiple IDs with different parameters in your selection match the same element in the map, a conflict occurs. Clicking on any edge/node where a conflict is present will display a table similar to one shown on the right. A list of conflicting IDs and their customization parameters is shown, with the keyword 'current' highlighting the currently applied parameters. Clicking the 'Select' button next to any ID will apply its customization parameters to the selected element. You can also apply the customization to all matching edges/nodes by clicking the 'All' button.
Saving and restoring element selections
Check our selection saving and time series video tutorial.
Saved selections legend
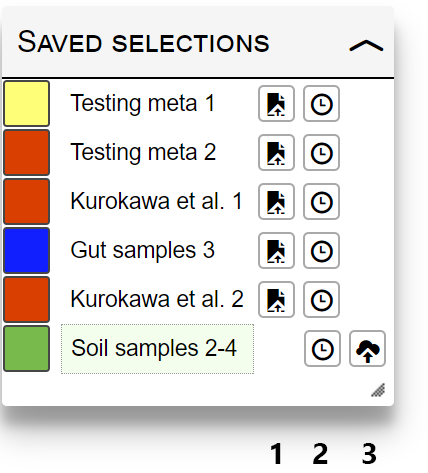
If a Selection title is specified when submitting data, all selection parameters will be stored, and can be simply accessed through the "Saved selections" box. Saved selections are tied to the current iPath overview map. If you switch to a different map, customization data must be submitted again.
Currently active selection will be highlighted with a green box. Use the function icons next to each saved selection name to:
- Restore: reset the current map and restore the selection values.
- Add to time series: add selection as the next time point in the time series
- Save: save the selection to any project in your iPath account. This icon will not be displayed for selections that are already saved.
Time series
Check our selection saving and time series video tutorial.
Time series control panel
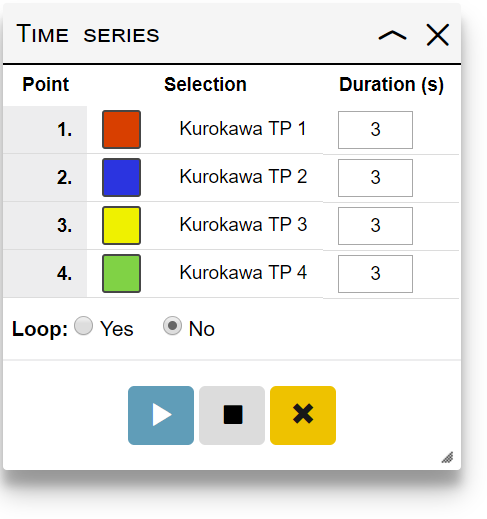
Use the time series functions to simply create an animation based on your map customizations. To create a time series animation:
- Create your map customizations for various data points, and submit them one by one. Selection titles must be provided, which will make the selections available in the Saved selections panel.
- Add the selections to the time series by clicking the icon in the Saved selections panel. Once the first selection is added, a Time series panel will appear.
- Specify the animation duration (in seconds) between each time point in the Time series panel
- Select whether the animation should loop or not
- Click the play/pause button
Currently playing animation can be paused by clicking the play/pause button, or stopped completely by clicking the stop button.
If you want to create movies of your iPath time series animations, we recommend using external screen recorder software. Freely available examples include:
Exporting maps
Customized maps in iPath can be saved in various output formats. Click the 'Export' tab in the control panel to access the export function. Maps can be exported into any of the following formats:
- Portable Network Graphics (png)
- Encapsulated Postscript (eps)
- Portable Document Format (pdf)
- Scalable Vector Graphics (svg)
Note: Due to technical limitations, transparency cannot be preserved in EPS and PDF formats.
Batch export and programmatic access
iPath supports programmatic submission of element selections and other customization parameters, either directly to the interactive interface, or for automatic generation of graphical files in vector and bitmap formats.
Please check the 'Direct submission' section on the Tools page for more information and detailed description of parameters/scripts.
Personal account
Check our iPath personal account video tutorial.
iPath user account
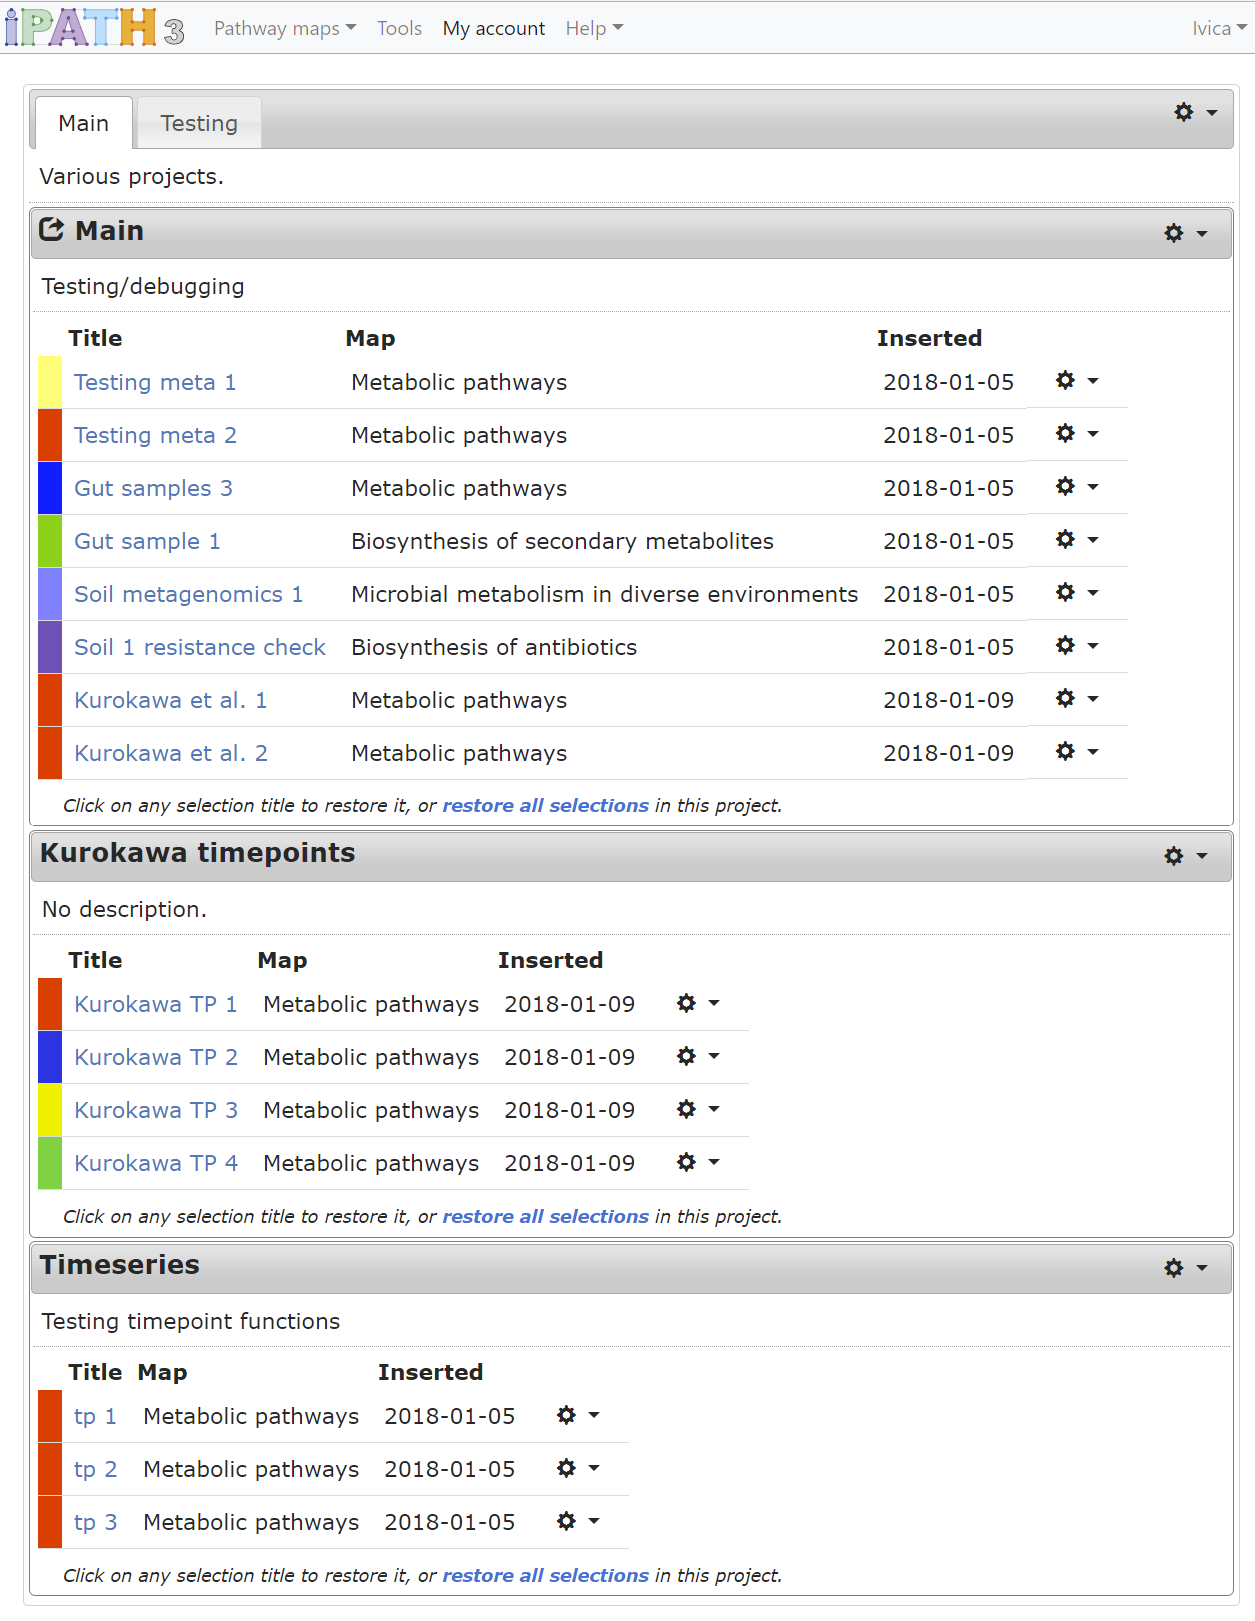
Creating an account in iPath gives you the possibility to easily organize your element selections and access them from any browser. Selections are grouped into different projects, and these can be arranged into different workspaces.
Configuration and functions can be accessed by clicking the icons in the corner of project boxes, in the workspace tab bar and at the end of each selection table row.
Working with projects and workspaces:
- Add/delete a workspace or a project through the functions menus ()
- Click the workspace label and drag it to rearrange workspace order
- Click the workspace or project descriptions to edit them
- Double click project title bars to collapse/un-collapse projects
- Click and drag the project title to rearrange projects
- Click and drag the project title to a different workspace tab label to move the project there
- Click and drag any selection to move it to a different project
Example dataset
Several example dataset are available:
- kurokawa_data.ipath.gz: which maps the enzymatic activity in the human gut microbiome
(metagenomic data derived from Japanese fecal samples).
First, second and third columns represent:
- ortholog ID in KEGG
- abundance of the OG (represented using element width, 'W')
- color in the map
- ID_conflict_example.zip: an example which will generate many conflicts, allowing you to test conflict resolution functionality
- timeseries_example.zip: these can also be accessed directly. After loading, add both selections to a timeseries, and click the 'play' button
- Ge_et_al_2015.txt: example for transcriptomics/metabolomics integration on the Biosynthesis of secondary metabolites (from Ge et al., Nature 2015.)